(Newland is boring – skip right to the coding!)
In the summer of 2015, I got a fantastic chance to help out with as astronomical observing run courtesy of UT Austin and McDonald Observatory (thanks to Dr. Keely Finkelstein), not to mention the generous support of our research advisor, Dr. Chris Sneden and his post doctoral student, Dr. Monika Adamow. We also had hands-on image processing lessons from McDonald Observatory education and public outreach staff members Dr. Judy Meyer, Rachel Fuechsl, and Marc Wetzel.


We learned to use the Las Cumbres Observatory Global Telescope which allows an observer to queue up observations of targets with parameters such as specific filters and time exposures. Then, what ever node has a clear view of that target within the time frame will take the exposures and put the raw data on the observers account. The raw FITS files can be easily converted into either TIFF or JPEG files which can be more easily worked with using image software.

For the HOC 2014, a group from Google CS First, PencilCode.net, AAS, NASA Chandra X-Ray Observatory, and Code.org created an interactive lesson teaching the basics of astronomical imaging, the basics of the computer science of imaging, and some computational thinking. Students learn to combine images of different colors to make a new image. They also learn to use color values and unique combinations to make their own original astronomical image.

I decided to take some raw data from the trip and have the students do a little web-based coding to demonstrate combining images using different filters. This will be a part of the Hour of Code 2015 event for my astronomy classes.
Hour Of Code Project: Start Here!
- Recolor – try creating a color by stimulating your own red, green, and blue eye cells with an intensity between 0 and 255. This is how computers create color.
- Scene – explore filters and color-shifting using a coloring function that maps input RGB colors to an output RGB colors.
- Flower – mash up two images using a coloring function to mix red, green, and blue light from multiple images.
- Bubble Nebula -see how astronomers combine different images to create a single colored image of a nebula (completed example)
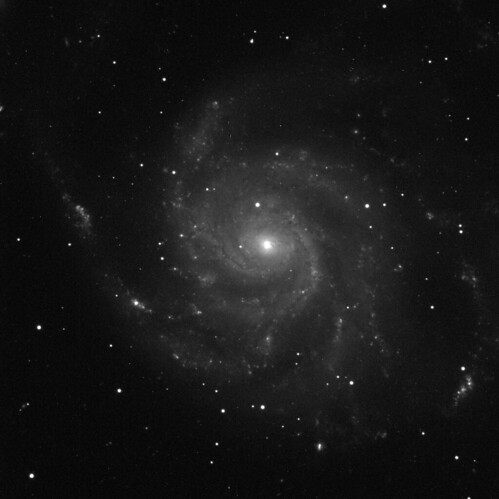
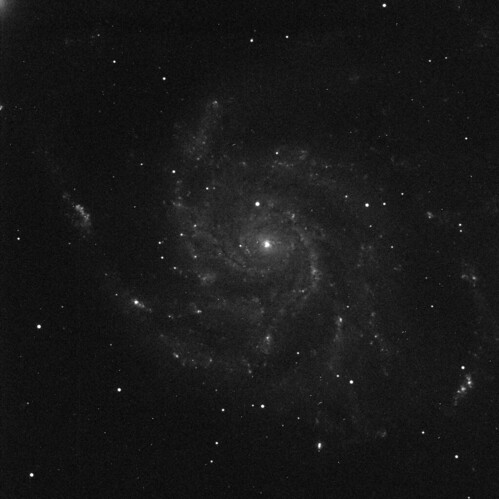
- M101 – try to use the r, v, and b to get an image of a galaxy
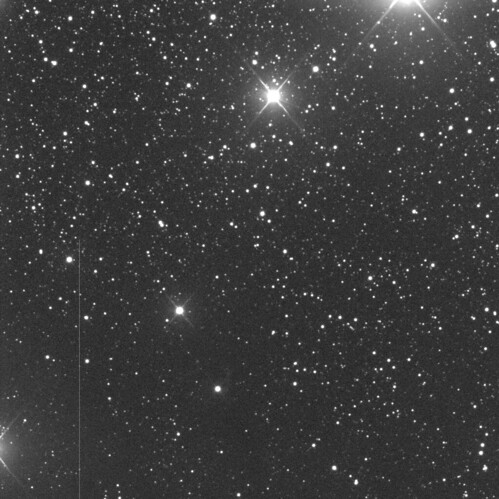
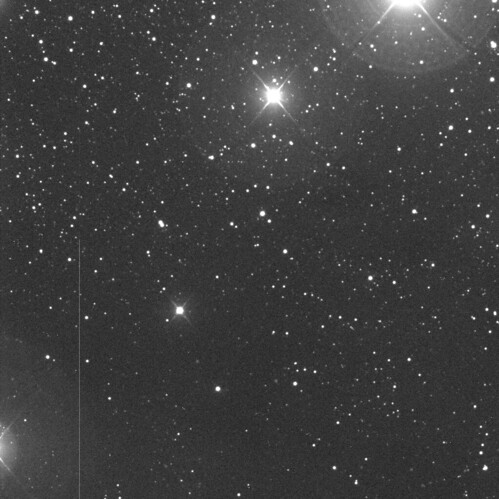
- North America Nebula – try to use the r, v, and b to get an image of a nebula
- supernova – see how astronomers combine different images to create a single colored image of the leftovers from a star exploding
- starforming – explore a deep six-wavelength stack of astronomy images, and create your own unique never-before-published RGB image of a star-forming region
- keplersnova – In 1604 a star suddenly exploded and became the brightest object in the sky. Examine the remnants of the supernova observed by Kepler in the 17th century
- blackhole – See x-ray data revealing a supermassive black hole at the center of a galaxy
Here are my attempts to create some pretty pictures. I converted the FITS files from LCOGT into TIFF files which I combined and processed using Photoshop. This takes more effort than just combing the colored images but aren’t they pretty?


