
Abstract
The pulse is an important vital sign that gives the medical state of a person. Access to affordable and reliable ways to measure vital signs is a struggle for many underserved communities. One solution is to create methods of measuring a pulse, or photoplethysmogram (ppg), using a camera from an existing device, like a smartphone or laptop. In this way, patients can connect to care-givers using telemedicine and their currently available devices. Telemedicine means patients can have remote access to care-givers in a more flexible way than traditional treatment pathways. Many devices exist for obtaining a ppg such as a pulse oximeter, but these devices require contact with the patient and are not easily integrated into telemedicine systems. The remote ppg technique allows for real-time analysis of the pulse using only a webcam. The remote ppg algorithm implemented here uses a user-selectable region of interest (roi) for which an intensity time-series is obtained. This project demonstrates a graphical user interface running on a computer for obtaining, analyzing, and visualizing the ppg waveform in real-time. Live signals of the remote ppg and a traditional pulse sensor are compared for ground truth analysis. The OpenCV and PyQtGraph packages in Python were used to create a relatively simple and robust way to obtain, analyze, and visualize the ppg in an engaging and accessible format which could be run locally or remotely. Future work would have the algorithm track the roi as the person moves in the frame.
Need to cite this? Use DOI: 10.13140/RG.2.2.12310.29765
See the poster from 2019 RET Summer Symposium
In the summer of 2019, I returned to the Rice University Scalable Health Lab in the Department of Electrical and Computer Engineering as part of a Research Experience for Teachers through the Rice Office of STEM Engagement.
What is photoplethysmography?

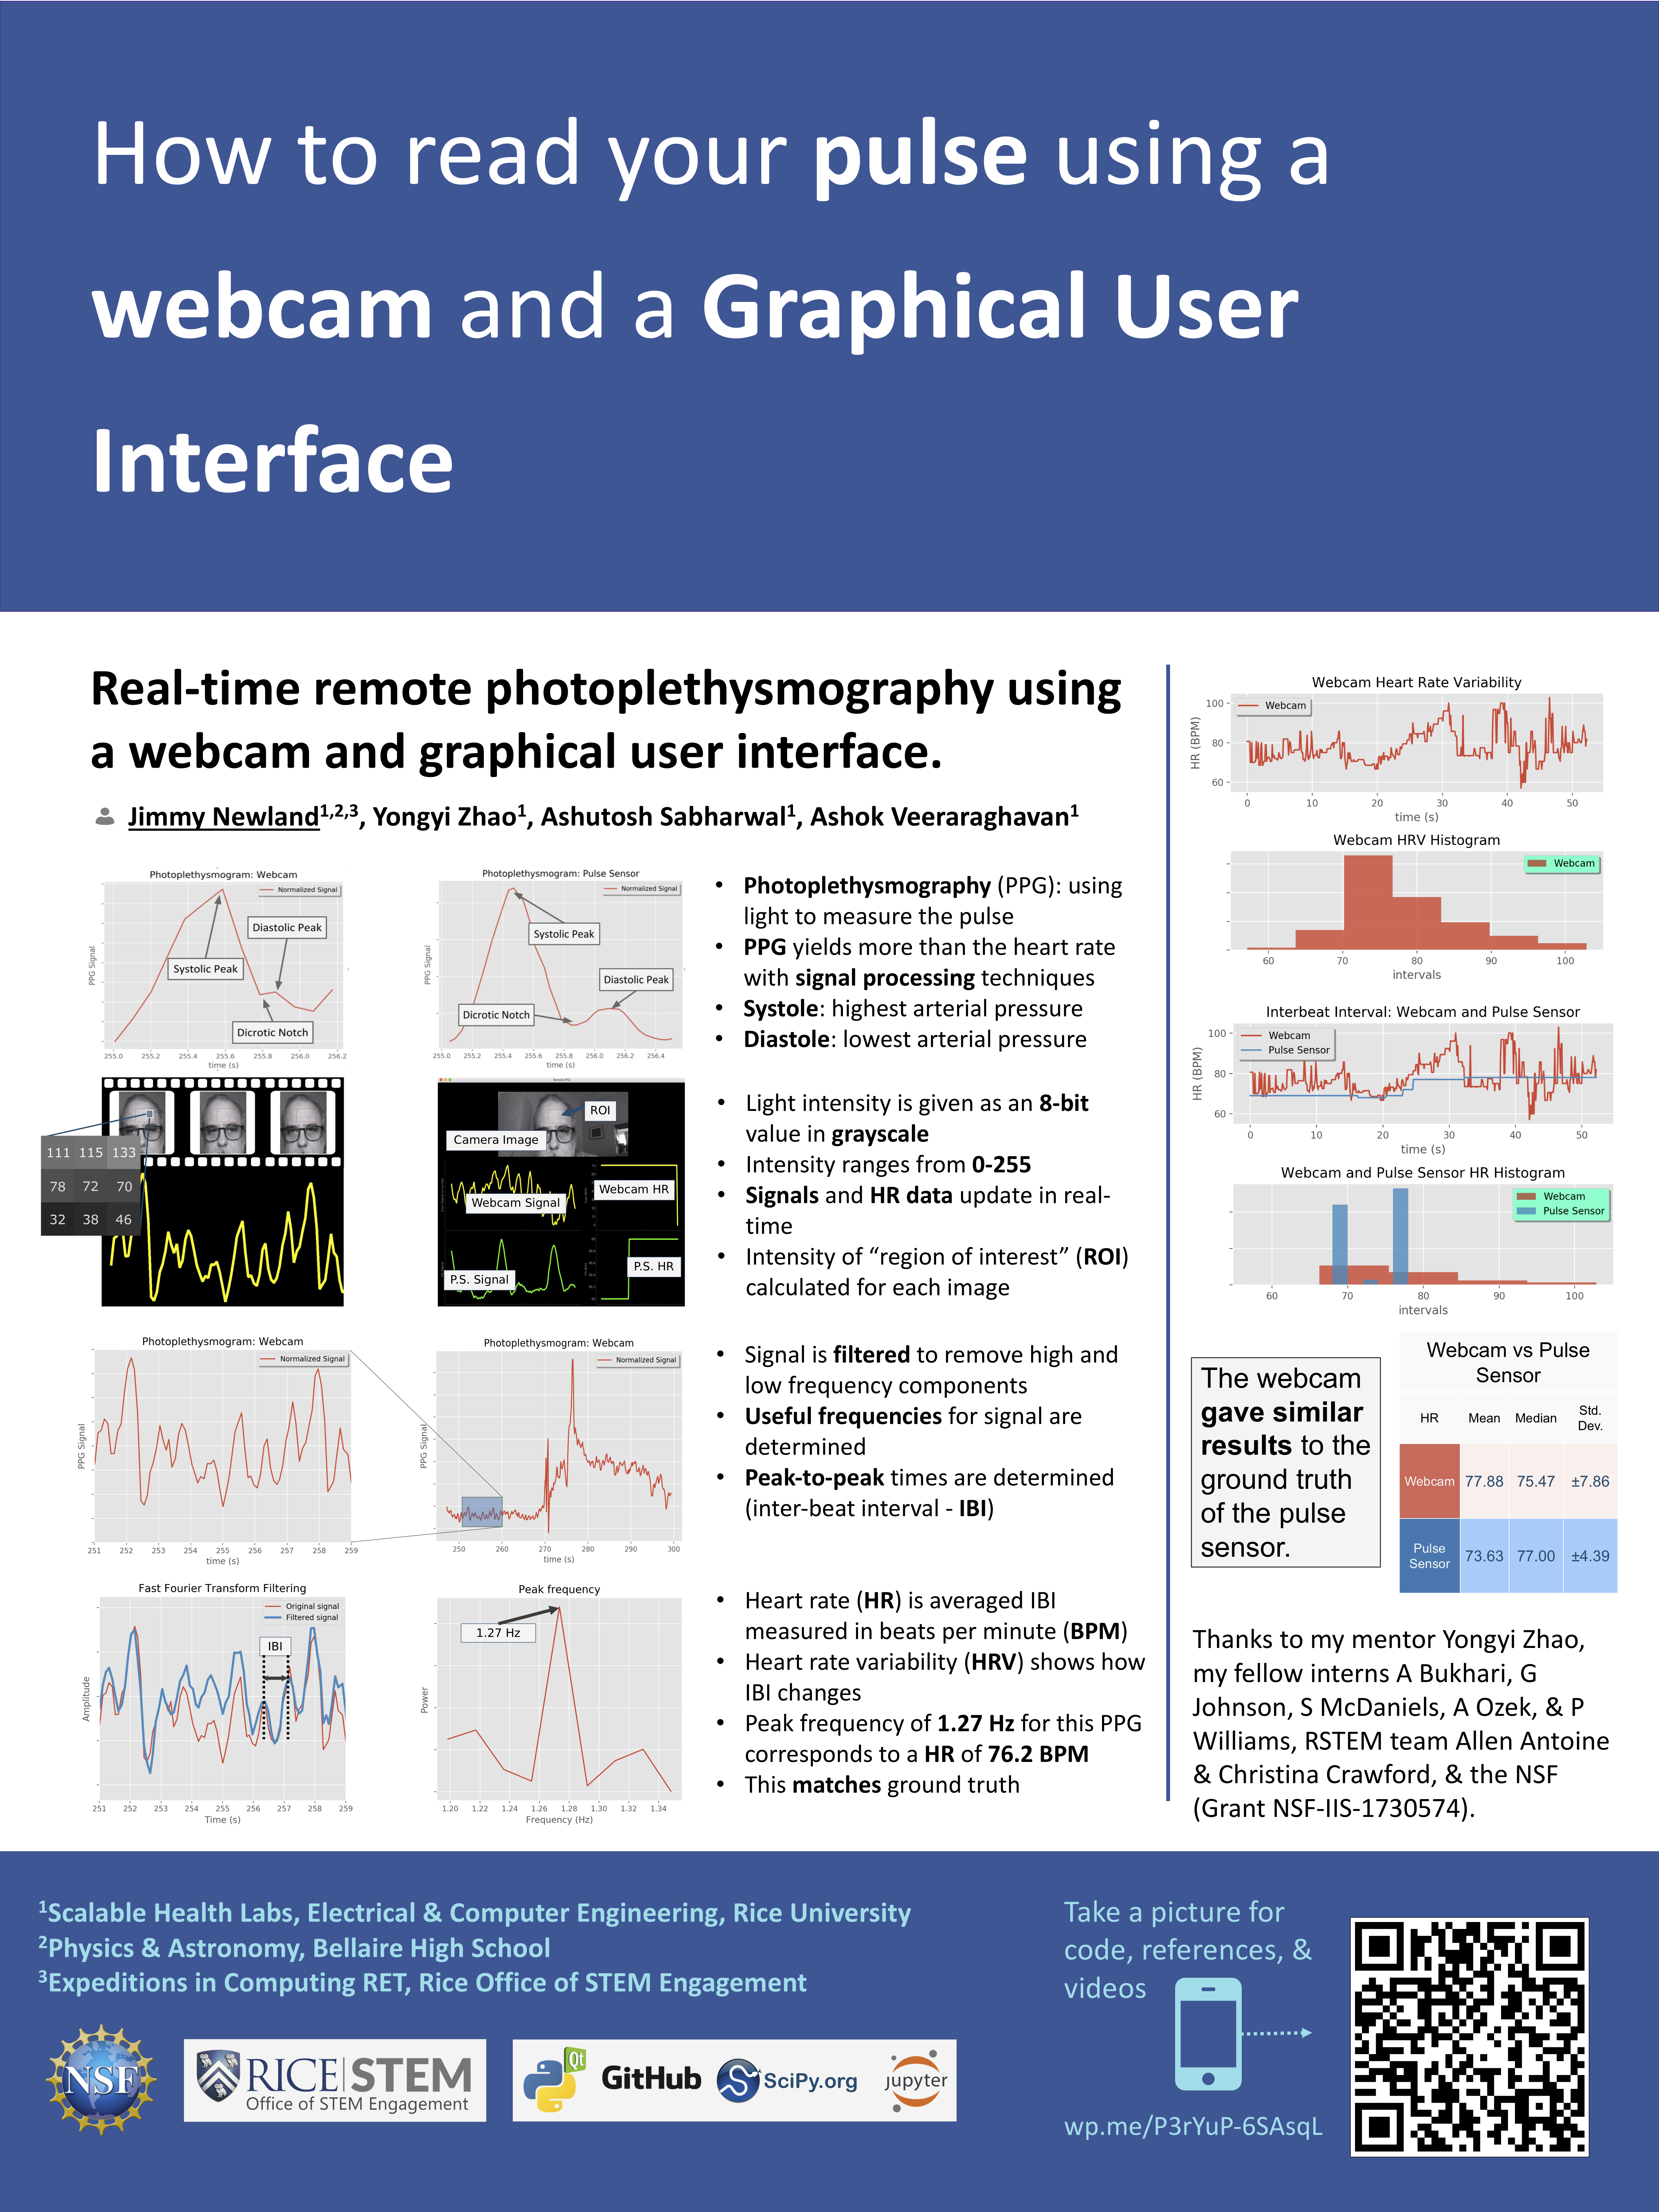
- Photoplethysmography (PPG): using light to measure the pulse
- PPG yields more than the heart rate with signal processing techniques
- Systole: highest arterial pressure
- Diastole: lowest arterial pressure
The first thing was to figure out how to read data from the webcam. Webcams generate digital images. The amount of light received by the camera in a particular pixel location is represented by a numerical value. I decided to use a small rectangular region of the image to measure the brightness of the skin at any given moment. When I look at this rectangle multiple times a second, I can see the brightness changing over time. The brightness changes as blood fills the capillary bed of the skin. There are a few areas where this capillary bed is close to the skin surface. If I keep the rectangle on such an area on my forehead, I can see the photoplethysmogram or ppg if I plot the brightness as a function of time. A ppg is a waveform that corresponds to the pulsing of blood through the body over time. The amount of blood in the capillary bed at any one time causes the amount of reflected light to vary slightly. This is the origin of the ppg as the camera sees light reflected off the skin. Most webcams take images, or frames, 30 or 60 times per second. This frame rate determines the quality or time-resolution of the signal. However, lots of other factors add things to the signal. This creates a poor signal to noise ratio. Some things can be done to mitigate the poor S/N: using a bright, broad-spectrum light near the face; holding the face still while keeping a rectangle over the same region of the forehead; placing the face close to the camera; using the green band of the red-blue-green image.
Webcam Pulse Reader- Remote PPG GUI

- Light intensity is given as an 8-bit value in grayscale
- Intensity ranges from 0-255
- Signals and HR data update in real- time
- Intensity of “region of interest” (ROI) calculated for each image
Once the data components were in place, I set about creating a graphical user interface to display the signals from the webcam pulse-reading algorithm and the finger sensor along with the heart rate and hrv from both. I opted to use Python for the excellent data visualization capabilities and because the Python community embraces open-source development and information sharing. Keeping my code open for others to use is important to me, personally. The GUI consists of an area where the video image of the subject along with the user-draggable and user-resizable region of interest, or roi, can be seen; an area where the real-time signal from the webcam and the real-time heart rate, hr, can be seen; and an area where the real-time signal and heart rate from the pulse sensor can be seen.
PPG Digital Signal Processing

- Signal is filtered to remove high and low frequency components
- Useful frequencies for signal are determined
- Peak-to-peak times are determined (inter-beat interval – IBI)
The program also saves the data from the 2 sensors along with a timestamp to a file for external analysis. Statistical analysis of the signals and heart rates showed that the signal from the webcam is very noisy and requires the subject to stay fairly still but that the algorithm does a mostly adequate job of matching the ground truth data from the finger sensor over a several minute period. The heart rate variability, however, was seemingly too noisy without further signal filtering applied. Ultimately, the graphical user interface allows the user to see the subject and the data together and could easily act as a base for future development in practical medical use. Further signal filtering and region tracking could enhance the data gathering as well. Additional features like a configuration menu and a save and load feature would also be excellent next steps to take.
Filtering with Fast-Fourier Transform

- Heart rate (HR) is averaged IBI measured in beats per minute (BPM)
- Heart rate variability (HRV) shows how IBI changes
- Peak frequency of 1.27 Hz for this PPG corresponds to a HR of 76.2 BPM
- This matches ground truth
Comparing Webcam and Pulse Sensor PPG


Example datasets are available here.
Overall, the project was a success and the real-time data coupled with the video feed allows just-in-time experiments with different region parameters for further analysis.
Acknowledgements
Thanks to my mentor Yongyi Zhao, my fellow interns Azka Bukhari, Gary Johnson, Shelia McDaniels, Ali Ozek, & Pamela Williams, RSTEM team Allen Antoine & Christina Crawford, & the NSF Expeditions in Computing (Grant NSF-IIS-1730574).


References and Citations
Journal Articles
- Alian, Aymen A., and Kirk H. Shelley. “Photoplethysmography.” Best Practice & Research Clinical Anaesthesiology 28, no. 4 (December 2014): 395–406. https://doi.org/10.1016/j.bpa.2014.08.006.
- Allen, John. “Photoplethysmography and Its Application in Clinical Physiological Measurement.” Physiological Measurement 28, no. 3 (March 1, 2007): R1–39. https://doi.org/10.1088/0967-3334/28/3/R01.
- Fischer, Christoph, Benno Domer, Thomas Wibmer, and Thomas Penzel. “An Algorithm for Real-Time Pulse Waveform Segmentation and Artifact Detection in Photoplethysmograms.” IEEE Journal of Biomedical and Health Informatics 21, no. 2 (March 2017): 372–81. https://doi.org/10.1109/JBHI.2016.2518202.
- Kamshilin, Alexei A., and Nikita B. Margaryants. “Origin of Photoplethysmographic Waveform at Green Light.” Physics Procedia 86 (2017): 72–80. https://doi.org/10.1016/j.phpro.2017.01.024.
- Kumar, Mayank, James Suliburk, Ashok Veeraraghavan, and Ashutosh Sabharwal. “PulseCam: High-Resolution Blood Perfusion Imaging Using a Camera and a Pulse Oximeter.” In 2016 38th Annual International Conference of the IEEE Engineering in Medicine and Biology Society (EMBC), 3904–9. Orlando, FL, USA: IEEE, 2016. https://doi.org/10.1109/EMBC.2016.7591581.
- Kumar, Mayank, Ashok Veeraraghavan, and Ashutosh Sabharwal. “DistancePPG: Robust Non-Contact Vital Signs Monitoring Using a Camera.” Biomedical Optics Express 6, no. 5 (May 1, 2015): 1565. https://doi.org/10.1364/BOE.6.001565.
- Pai, Amruta, Ashok Veeraraghavan, and Ashutosh Sabharwal. “CameraHRV: Robust Measurement of Heart Rate Variability Using a Camera.” In Optical Diagnostics and Sensing XVIII: Toward Point-of-Care Diagnostics, edited by Gerard L. Coté, 27. San Francisco, United States: SPIE, 2018. https://doi.org/10.1117/12.2289205.
Websites & Blogs
- Luke Campagnola, “PyQtGraph Documentation”, (July 2019), http://www.pyqtgraph.org/documentation/index.html
- Joel Murphy & Yury Gitman, “Getting Advanced”, (July 2018), https://pulsesensor.com/pages/getting-advanced
- Jimmy Newland, “DIY PPG”, (July 2019), https://www.jimmynewland.com/wp/about-jimmy/presentations/comparing-ppg-signals-open-vs-closed/
- OpenCV Documentation, “OpenCV-Python Tutorials”, (July 2019), https://opencv-python-tutroals.readthedocs.io/en/latest/py_tutorials/py_tutorials.html
- PythonProgramming.net, “OpenCV Tutorial”, (June 2019), https://pythonprogramming.net/loading-images-python-opencv-tutorial/
- Paul van Gent, “Analyzing a Discrete Heart Rate Signal Using Python”, (March 2016), http://www.paulvangent.com/2016/03/15/analyzing-a-discrete-heart-rate-signal-using-python-part-1/
- Gaël Varoquaux, Adrien Chauve, Andre Espaze, Emmanuelle Gouillart, Ralf Gommers, “SciPy FFT Lecture Notes”, (July 2019), https://scipy-lectures.org/intro/scipy/auto_examples/plot_fftpack.html
Code Repositories
- Justin Johnson, “Python Numpy Tutorial”, (June 2019), http://cs231n.github.io/python-numpy-tutorial/
- Udayan Kumar, “Heart Beat sensor using Raspberry Pi and Pulse Sensor”, (June 2016), GitHub repository, https://github.com/udayankumar/heart-rate-raspberry-pi/
- Joel Murphy & Yury Gitman, “Pulse Sensor Projects Repository”, (July 2018), GitHub repository, https://github.com/WorldFamousElectronics
- Jimmy Newland, “PATHS-UP RET 2018”, (July 2019), https://github.com/PATHS-UP-RET/paths-up-expeditions-in-computing-ret201
- Alex Riss, “Read heart rate data (using the pulse sensor) and compute heart rate variability parameters.”, (March 2015), GitHub repository, https://github.com/alexriss/heartex
- User tobac, “Python client for Contec CMS50EW pulse oximeter”, (April, 2017), GitHub repository, https://github.com/tobac/cms50ew
- François-Xavier Thomas, “PyQtGraph Examples”, (June 2019), https://github.com/fxthomas/pg-examples/blob/master/linked_rois.py
- Paul van Gent, “Python Heart Rate Analysis Toolkit”, (July 2018), GitHub repository, https://github.com/paulvangentcom/heartrate_analysis_pytho
My Code
The code used to complete this project was almost exclusively released as open source. As a result, I am releasing the code and sample data as open source as well. Links can be found below.

- PATHS-UP/Expeditions in Computing GitHub Repository
- Jupyter Notebook used to determine results (Azure Notebook also contains sample datasets)